Redis HA clustering
Description
Redis is a popular key value cache store. This solution is for a high availability enterprise cluster with N+1 redundancy allowing complete failure of 1 component or host.
Solution
This walk through describes the steps required to deploy the redis service to 3 servers resulting in redis and sentinel running for 2+1 high availability specification. This solution is written for CentOS / RHEL, update paths and packer manager for other distrubitions. Ive used 3 KVM with 2xCPU 2GB RAM and 10GB storage. There is a final step showing how to collect metrics for prometheus monitoring.
Pre requisites
Configure 3 linux hosts on the same subnet. Disable SELinux and iptables for speed on this walk through deployment.
- setenforce 0
- iptables -F
Install Redis packages
For CentOS 7 we can get redis from EPEL. Redis Sentinel is a part of the standard redis package. Install to all 3 servers.
yum install -y epel-release
yum install -y redis
At time of writing redis 3.2 was installed.
$ rpm -qa redis
redis-3.2.12-2.el7.x86_64
Prerequisites configuration files
Edit your /etc/redis.conf file.
By default redis will only listen on localhost. As we need Connectivity from 2 other hosts we need to comment out the bind option to listen on all interfaces.
#bind 127.0.0.1
Protected mode is enabled by default, disable to allow connections from other hosts.
protected no
Configure master redis instance 6379 (redis-1 host)
Start redis daemon.
[root@redis-1 ~]# systemctl start redis
[root@redis-1 ~]# systemctl status redis
● redis.service - Redis persistent key-value database
   Loaded: loaded (/usr/lib/systemd/system/redis.service; disabled; vendor preset: disabled)
  Drop-In: /etc/systemd/system/redis.service.d
           └─limit.conf
   Active: active (running) since Sat 2020-03-21 16:54:24 GMT; 2s ago
 Main PID: 1495 (redis-server)
   CGroup: /system.slice/redis.service
           └─1495 /usr/bin/redis-server 127.0.0.1:6379

Mar 21 16:54:24 redis-1.home.lan systemd[1]: Starting Redis persistent key-value database...
Mar 21 16:54:24 redis-1.home.lan systemd[1]: Started Redis persistent key-value database.
Get current redis daemon status.
[root@redis-1 ~]# redis-cli -p 6379 info server
# Server
redis_version:3.2.12
redis_git_sha1:00000000
redis_git_dirty:0
redis_build_id:7897e7d0e13773f
redis_mode:standalone
os:Linux 3.10.0-1062.12.1.el7.x86_64 x86_64
arch_bits:64
multiplexing_api:epoll
gcc_version:4.8.5
process_id:1495
run_id:bfb674d8ad1fbb15a280ee68c51da5d6ac391701
tcp_port:6379
uptime_in_seconds:103
uptime_in_days:0
hz:10
lru_clock:7751463
executable:/usr/bin/redis-server
config_file:/etc/redis.conf
Get replication info showing this is a master.
[root@redis-1 ~]# redis-cli -p 6379 info replication
# Replication
role:master
connected_slaves:0
master_repl_offset:0
repl_backlog_active:0
repl_backlog_size:1048576
repl_backlog_first_byte_offset:0
repl_backlog_histlen:0
Configure slave instances (redis-2 and redis-3)
With the master redis instance online on host redis-1 we can now configure slave instances 2 and 3 and join the cluster. They will intitally be masters until replication is setup. Official redis replication documentation
Redis-2
Start redis daemon.
[root@redis-2 ~]# systemctl start redis
[root@redis-2 ~]# systemctl status redis
● redis.service - Redis persistent key-value database
   Loaded: loaded (/usr/lib/systemd/system/redis.service; disabled; vendor preset: disabled)
  Drop-In: /etc/systemd/system/redis.service.d
           └─limit.conf
   Active: active (running) since Sat 2020-03-21 16:59:23 GMT; 8s ago
 Main PID: 1517 (redis-server)
   CGroup: /system.slice/redis.service
           └─1517 /usr/bin/redis-server 127.0.0.1:6379

Mar 21 16:59:23 redis-2.home.lan systemd[1]: Starting Redis persistent key-value database...
Mar 21 16:59:23 redis-2.home.lan systemd[1]: Started Redis persistent key-value database.
Get replication info showing this is a new master. We will then configure as slave.
[root@redis-2 ~]# redis-cli -p 6379 info replication
# Replication
role:master
connected_slaves:0
master_repl_offset:0
repl_backlog_active:0
repl_backlog_size:1048576
repl_backlog_first_byte_offset:0
repl_backlog_histlen:0
Issue command to make redis-2 slave of redis-1, you will need the IP address of your redis-1 host.
[root@redis-2 ~]# redis-cli -p 6379 slaveof 192.168.0.61 6379
OK
Confirm this is now a slave of redis-1. Notice the master host IP address and status is up.
[root@redis-2 ~]# redis-cli -p 6379 info replication
# Replication
role:slave
master_host:192.168.0.61
master_port:6379
master_link_status:up
master_last_io_seconds_ago:0
master_sync_in_progress:0
slave_repl_offset:126519
slave_priority:100
slave_read_only:1
connected_slaves:0
master_repl_offset:0
repl_backlog_active:0
repl_backlog_size:1048576
repl_backlog_first_byte_offset:0
repl_backlog_histlen:0
Redis-3
Start redis daemon.
[root@redis-3 ~]# systemctl start redis
[root@redis-3 ~]# systemctl status redis
● redis.service - Redis persistent key-value database
   Loaded: loaded (/usr/lib/systemd/system/redis.service; disabled; vendor preset: disabled)
  Drop-In: /etc/systemd/system/redis.service.d
           └─limit.conf
   Active: active (running) since Sat 2020-03-21 16:59:24 GMT; 8min ago
 Main PID: 1490 (redis-server)
   CGroup: /system.slice/redis.service
           └─1490 /usr/bin/redis-server 127.0.0.1:6379

Mar 21 16:59:24 redis-3.home.lan systemd[1]: Starting Redis persistent key-value database...
Mar 21 16:59:24 redis-3.home.lan systemd[1]: Started Redis persistent key-value database.
Get replication info showing this is a new master. We will then configure as slave.
[root@redis-3 ~]# redis-cli -p 6379 info replication
# Replication
role:master
connected_slaves:0
master_repl_offset:0
repl_backlog_active:0
repl_backlog_size:1048576
repl_backlog_first_byte_offset:0
repl_backlog_histlen:0
Issue command to make redis-3 slave of redis-1.
[root@redis-3 ~]# redis-cli -p 6379 slaveof 192.168.0.61 6379
OK
Confirm replication status with redis-1.
[root@redis-3 ~]# redis-cli -p 6379 info replication
# Replication
role:slave
master_host:192.168.0.61
master_port:6379
master_link_status:up
master_last_io_seconds_ago:2
master_sync_in_progress:0
slave_repl_offset:124580
slave_priority:100
slave_read_only:1
connected_slaves:0
master_repl_offset:0
repl_backlog_active:0
repl_backlog_size:1048576
repl_backlog_first_byte_offset:0
repl_backlog_histlen:0
Configure Redis Sentinels
Here we will remove the default redis master to monitor ‘mymaster’. We then issue command to start monitoring our master on its IP address. We give the cluster a new group name ‘app-cache’ and configure with a quorum of 2.
The quorum is the number of seninels that must be in agreement to trigger a failover and there by promoting a slave to new master. The full command specification is as follows:
sentinel monitor <master-group-name> <ip> <port> <quorum>
For full documentation on redis sentinel see the Official Redis Sentinel Documentation.
Redis-1
Start the sentinel daemon.
[root@redis-1 ~]# systemctl start redis-sentinel
[root@redis-1 ~]# systemctl status redis-sentinel
● redis-sentinel.service - Redis Sentinel
   Loaded: loaded (/usr/lib/systemd/system/redis-sentinel.service; disabled; vendor preset: disabled)
  Drop-In: /etc/systemd/system/redis-sentinel.service.d
           └─limit.conf
   Active: active (running) since Sat 2020-03-21 17:11:11 GMT; 3s ago
 Main PID: 1528 (redis-sentinel)
   CGroup: /system.slice/redis-sentinel.service
           └─1528 /usr/bin/redis-sentinel *:26379 [sentinel]

Mar 21 17:11:11 redis-1.home.lan systemd[1]: Starting Redis Sentinel...
Mar 21 17:11:11 redis-1.home.lan systemd[1]: Started Redis Sentinel.
Review initial configuration.
[root@redis-1 ~]# redis-cli -p 26379 info sentinel
# Sentinel
sentinel_masters:1
sentinel_tilt:0
sentinel_running_scripts:0
sentinel_scripts_queue_length:0
sentinel_simulate_failure_flags:0
master0:name=mymaster,status=ok,address=127.0.0.1:6379,slaves=0,sentinels=1
Remove the default master monitor ‘mymaster’. We will issue new monitoring command for our cluster using the master IP address and giving it a service name specific to our use case.
[root@redis-1 ~]#  redis-cli -p 26379 sentinel remove mymaster
OK
[root@redis-1 ~]#  redis-cli -p 26379 info sentinel
# Sentinel
sentinel_masters:0
sentinel_tilt:0
sentinel_running_scripts:0
sentinel_scripts_queue_length:0
sentinel_simulate_failure_flags:0
Issue command to start monitoring new redis master. Here we name the redis cache as app-cache with a quorum of 2.
[root@redis-1 ~]# redis-cli -p 26379 sentinel monitor app-cache 192.168.0.61 6379 2
OK
Confirm we have new cluster monitored, notice the number of slaves and sentinels.
[root@redis-1 ~]# redis-cli -p 26379 info sentinel
# Sentinel
sentinel_masters:1
sentinel_tilt:0
sentinel_running_scripts:0
sentinel_scripts_queue_length:0
sentinel_simulate_failure_flags:0
master0:name=app-cache,status=ok,address=192.168.0.61:6379,slaves=2,sentinels=1
Redis-2
Start the sentinel daemon.
[root@redis-2 ~]# systemctl start redis-sentinel
[root@redis-2 ~]# systemctl status redis-sentinel
● redis-sentinel.service - Redis Sentinel
   Loaded: loaded (/usr/lib/systemd/system/redis-sentinel.service; disabled; vendor preset: disabled)
  Drop-In: /etc/systemd/system/redis-sentinel.service.d
           └─limit.conf
   Active: active (running) since Sat 2020-03-21 18:27:10 GMT; 5s ago
 Main PID: 7189 (redis-sentinel)
   CGroup: /system.slice/redis-sentinel.service
           └─7189 /usr/bin/redis-sentinel *:26379 [sentinel]

Mar 21 18:27:10 redis-2.home.lan systemd[1]: Starting Redis Sentinel...
Mar 21 18:27:10 redis-2.home.lan systemd[1]: Started Redis Sentinel.
Review initial configuration.
[root@redis-2 ~]# redis-cli -p 26379 info sentinel
# Sentinel
sentinel_masters:1
sentinel_tilt:0
sentinel_running_scripts:0
sentinel_scripts_queue_length:0
sentinel_simulate_failure_flags:0
master0:name=mymaster,status=ok,address=127.0.0.1:6379,slaves=0,sentinels=2
Remove the default master monitor ‘mymaster’.
[root@redis-1 ~]#  redis-cli -p 26379 sentinel remove mymaster
OK
[root@redis-1 ~]#  redis-cli -p 26379 info sentinel
# Sentinel
sentinel_masters:0
sentinel_tilt:0
sentinel_running_scripts:0
sentinel_scripts_queue_length:0
sentinel_simulate_failure_flags:0
Issue command to start monitoring new redis master on redis-1 host.
[root@redis-2 ~]# redis-cli -p 26379 sentinel monitor app-cache 192.168.0.61 6379 2
OK
Confirm we have new sentinel monitoring cluster, notice the number of slaves and now extra sentinel (2).
[root@redis-2 ~]# redis-cli -p 26379 info sentinel
# Sentinel
sentinel_masters:1
sentinel_tilt:0
sentinel_running_scripts:0
sentinel_scripts_queue_length:0
sentinel_simulate_failure_flags:0
master0:name=app-cache,status=ok,address=192.168.0.61:6379,slaves=0,sentinels=2
Redis-3
Start the sentinel daemon.
[root@redis-3 ~]# systemctl start redis-sentinel
[root@redis-3 ~]#  systemctl status redis-sentinel
● redis-sentinel.service - Redis Sentinel
   Loaded: loaded (/usr/lib/systemd/system/redis-sentinel.service; disabled; vendor preset: disabled)
  Drop-In: /etc/systemd/system/redis-sentinel.service.d
           └─limit.conf
   Active: active (running) since Sat 2020-03-21 18:28:50 GMT; 3s ago
 Main PID: 7121 (redis-sentinel)
   CGroup: /system.slice/redis-sentinel.service
           └─7121 /usr/bin/redis-sentinel *:26379 [sentinel]

Mar 21 18:28:50 redis-3.home.lan systemd[1]: Starting Redis Sentinel...
Mar 21 18:28:50 redis-3.home.lan systemd[1]: Started Redis Sentinel.
Review initial configuration.
[root@redis-3 ~]# redis-cli -p 26379 info sentinel
# Sentinel
sentinel_masters:1
sentinel_tilt:0
sentinel_running_scripts:0
sentinel_scripts_queue_length:0
sentinel_simulate_failure_flags:0
master0:name=mymaster,status=ok,address=127.0.0.1:6379,slaves=0,sentinels=2
Remove the default master monitor ‘mymaster’.
[root@redis-1 ~]#  redis-cli -p 26379 sentinel remove mymaster
OK
[root@redis-1 ~]#  redis-cli -p 26379 info sentinel
# Sentinel
sentinel_masters:0
sentinel_tilt:0
sentinel_running_scripts:0
sentinel_scripts_queue_length:0
sentinel_simulate_failure_flags:0
Issue command to start monitoring new redis master on redis-1 host.
[root@redis-3 ~]# redis-cli -p 26379 sentinel monitor app-cache 192.168.0.61 6379 2
OK
Confirm we have new sentinel monitoring cluster, notice the number of slaves and now extra sentinel (3).
[root@redis-3 ~]# redis-cli -p 26379 info sentinel
# Sentinel
sentinel_masters:1
sentinel_tilt:0
sentinel_running_scripts:0
sentinel_scripts_queue_length:0
sentinel_simulate_failure_flags:0
master0:name=app-cache,status=ok,address=192.168.0.61:6379,slaves=0,sentinels=3
Testing
Confirmation of slaves connected on master
[root@redis-1 ~]# redis-cli -p 6379 info replication
# Replication
role:master
connected_slaves:2
slave0:ip=192.168.0.63,port=6379,state=online,offset=193884,lag=0
slave1:ip=192.168.0.62,port=6379,state=online,offset=193884,lag=0
master_repl_offset:193884
repl_backlog_active:1
repl_backlog_size:1048576
repl_backlog_first_byte_offset:2
repl_backlog_histlen:193883
Writing a key to master confirmation of replication to slaves
[root@redis-1 ~]# redis-cli -p 6379 set my_value 100
OK
[root@redis-1 ~]# redis-cli -p 6379 get my_value
"100"

[root@redis-2 ~]# redis-cli -p 6379 get my_value
"100"

[root@redis-3 ~]# redis-cli -p 6379 get my_value
"100"
Force failover with sentinel
View master status.
[root@redis-2 redis]# redis-cli -p 26379 info sentinel
# Sentinel
sentinel_masters:1
sentinel_tilt:0
sentinel_running_scripts:0
sentinel_scripts_queue_length:0
sentinel_simulate_failure_flags:0
master0:name=app-cache,status=ok,address=192.168.0.61:6379,slaves=2,sentinels=3
Force failover.
[root@redis-2 redis]# redis-cli -p 26379 sentinel failover app-cache
OK
Confirm new master IP address has changed in sentinel monitor.
[root@redis-2 redis]# redis-cli -p 26379 info sentinel
# Sentinel
sentinel_masters:1
sentinel_tilt:0
sentinel_running_scripts:0
sentinel_scripts_queue_length:0
sentinel_simulate_failure_flags:0
master0:name=app-cache,status=ok,address=192.168.0.62:6379,slaves=2,sentinels=3
Confirm new master redis instance is master and has slaves attached.
[root@redis-2 redis]# redis-cli -p 6379 info replication
# Replication
role:master
connected_slaves:2
slave0:ip=192.168.0.61,port=6379,state=online,offset=891455,lag=1
slave1:ip=192.168.0.63,port=6379,state=online,offset=891597,lag=1
master_repl_offset:891739
repl_backlog_active:1
repl_backlog_size:1048576
repl_backlog_first_byte_offset:886270
repl_backlog_histlen:5470
Monitoring with grafana and prometheus.
I use prometheus for metrics. In order for prometheus to collect metrics it needs to scrape the agent exporter available HERE.
Setup redis exporter
Download the release package.
[root@redis-1 ~]# curl -L -O https://github.com/oliver006/redis_exporter/releases/download/v1.5.2/redis_exporter-v1.5.2.linux-amd64.tar.gz
  % Total    % Received % Xferd  Average Speed   Time    Time     Time  Current
                                 Dload  Upload   Total   Spent    Left  Speed
100   630  100   630    0     0   1536      0 --:--:-- --:--:-- --:--:--  1544
100 3281k  100 3281k    0     0  1223k      0  0:00:02  0:00:02 --:--:-- 1638k
Extract the contents.
[root@redis-1 ~]# tar xvf redis_exporter-v1.5.2.linux-amd64.tar.gz
redis_exporter-v1.5.2.linux-amd64/
redis_exporter-v1.5.2.linux-amd64/redis_exporter
redis_exporter-v1.5.2.linux-amd64/LICENSE
redis_exporter-v1.5.2.linux-amd64/README.md
Copy the binary to bin folder.
[root@redis-1 ~]# cd redis_exporter-v1.5.2.linux-amd64

[root@redis-1 redis_exporter-v1.5.2.linux-amd64]# cp redis_exporter /usr/local/bin/
Setup systemd file.
[root@redis-1 redis_exporter-v1.5.2.linux-amd64]# cat > /etc/systemd/system/redis_exporter.service << EOF
[Unit]
Description=NodeExporter

[Service]
TimeoutStartSec=0
ExecStart=/usr/local/bin/redis_exporter -redis.addr "redis://localhost:6379"

[Install]
WantedBy=multi-user.target
EOF
Reload systemd and start the exporter.
[root@redis-1 redis_exporter-v1.5.2.linux-amd64]# systemctl daemon-reload
[root@redis-1 redis_exporter-v1.5.2.linux-amd64]# systemctl start redis_exporter
[root@redis-1 redis_exporter-v1.5.2.linux-amd64]# systemctl status redis_exporter
● redis_exporter.service - NodeExporter
   Loaded: loaded (/etc/systemd/system/redis_exporter.service; disabled; vendor preset: disabled)
   Active: active (running) since Sat 2020-03-21 19:03:51 GMT; 3s ago
 Main PID: 7289 (redis_exporter)
   CGroup: /system.slice/redis_exporter.service
           └─7289 /usr/local/bin/redis_exporter -redis.addr redis://localhost:6379

Mar 21 19:03:51 redis-1.home.lan systemd[1]: Started NodeExporter.
Mar 21 19:03:51 redis-1.home.lan redis_exporter[7289]: time="2020-03-21T19:03:51Z" level=info msg="Redis Metrics Exporter v1.5.2    build date: 2020-03-16-20:52:04    sha1: 18080da36b0a9759...ARCH: amd64"
Mar 21 19:03:51 redis-1.home.lan redis_exporter[7289]: time="2020-03-21T19:03:51Z" level=info msg="Providing metrics at :9121/metrics"
Hint: Some lines were ellipsized, use -l to show in full.
Configure prometheus
I assume you already have a prometheus server installed and configured for your network. Adding config for the redis exporter is straightforward. The config for prometheus /etc/prometheus/prometheus.yml would be as follows for redis-1 2 and 3.
  - job_name: redis_exporter
    static_configs:
    - targets: ['192.168.0.61:9121']
    - targets: ['192.168.0.62:9121']
    - targets: ['192.168.0.63:9121']
Add dashboard to grafana
Again it is assumed you are using grafana to visualise prometheus metrics. The dashboard to use is available for import here:
https://grafana.com/grafana/dashboards/763
Benchmark redis
The redis comes with a benchmarking tool. This tool has a number of use cases here i create 1 million keys in the master instance.
[root@redis-1 ~]# redis-benchmark -t set -n 1000000 -r 100000000 -h 192.168.0.62 -p 6379
====== SET ======
1000000 requests completed in 124.90 seconds
50 parallel clients
3 bytes payload
keep alive: 1
0.00% <= 1 milliseconds
0.02% <= 2 milliseconds
39.94% <= 3 milliseconds
92.74% <= 4 milliseconds
99.38% <= 5 milliseconds
99.66% <= 6 milliseconds
99.75% <= 7 milliseconds
99.81% <= 8 milliseconds
99.85% <= 9 milliseconds
99.90% <= 10 milliseconds
99.92% <= 11 milliseconds
99.94% <= 12 milliseconds
99.95% <= 13 milliseconds
99.96% <= 14 milliseconds
99.97% <= 15 milliseconds
99.97% <= 16 milliseconds
99.97% <= 17 milliseconds
99.97% <= 18 milliseconds
99.97% <= 19 milliseconds
99.97% <= 20 milliseconds
99.98% <= 21 milliseconds
99.98% <= 22 milliseconds
99.98% <= 23 milliseconds
99.99% <= 24 milliseconds
99.99% <= 25 milliseconds
99.99% <= 26 milliseconds
99.99% <= 27 milliseconds
99.99% <= 43 milliseconds
99.99% <= 44 milliseconds
99.99% <= 45 milliseconds
99.99% <= 46 milliseconds
99.99% <= 47 milliseconds
99.99% <= 48 milliseconds
99.99% <= 49 milliseconds
99.99% <= 50 milliseconds
100.00% <= 51 milliseconds
100.00% <= 52 milliseconds
100.00% <= 53 milliseconds
100.00% <= 54 milliseconds
100.00% <= 55 milliseconds
100.00% <= 56 milliseconds
100.00% <= 57 milliseconds
100.00% <= 57 milliseconds
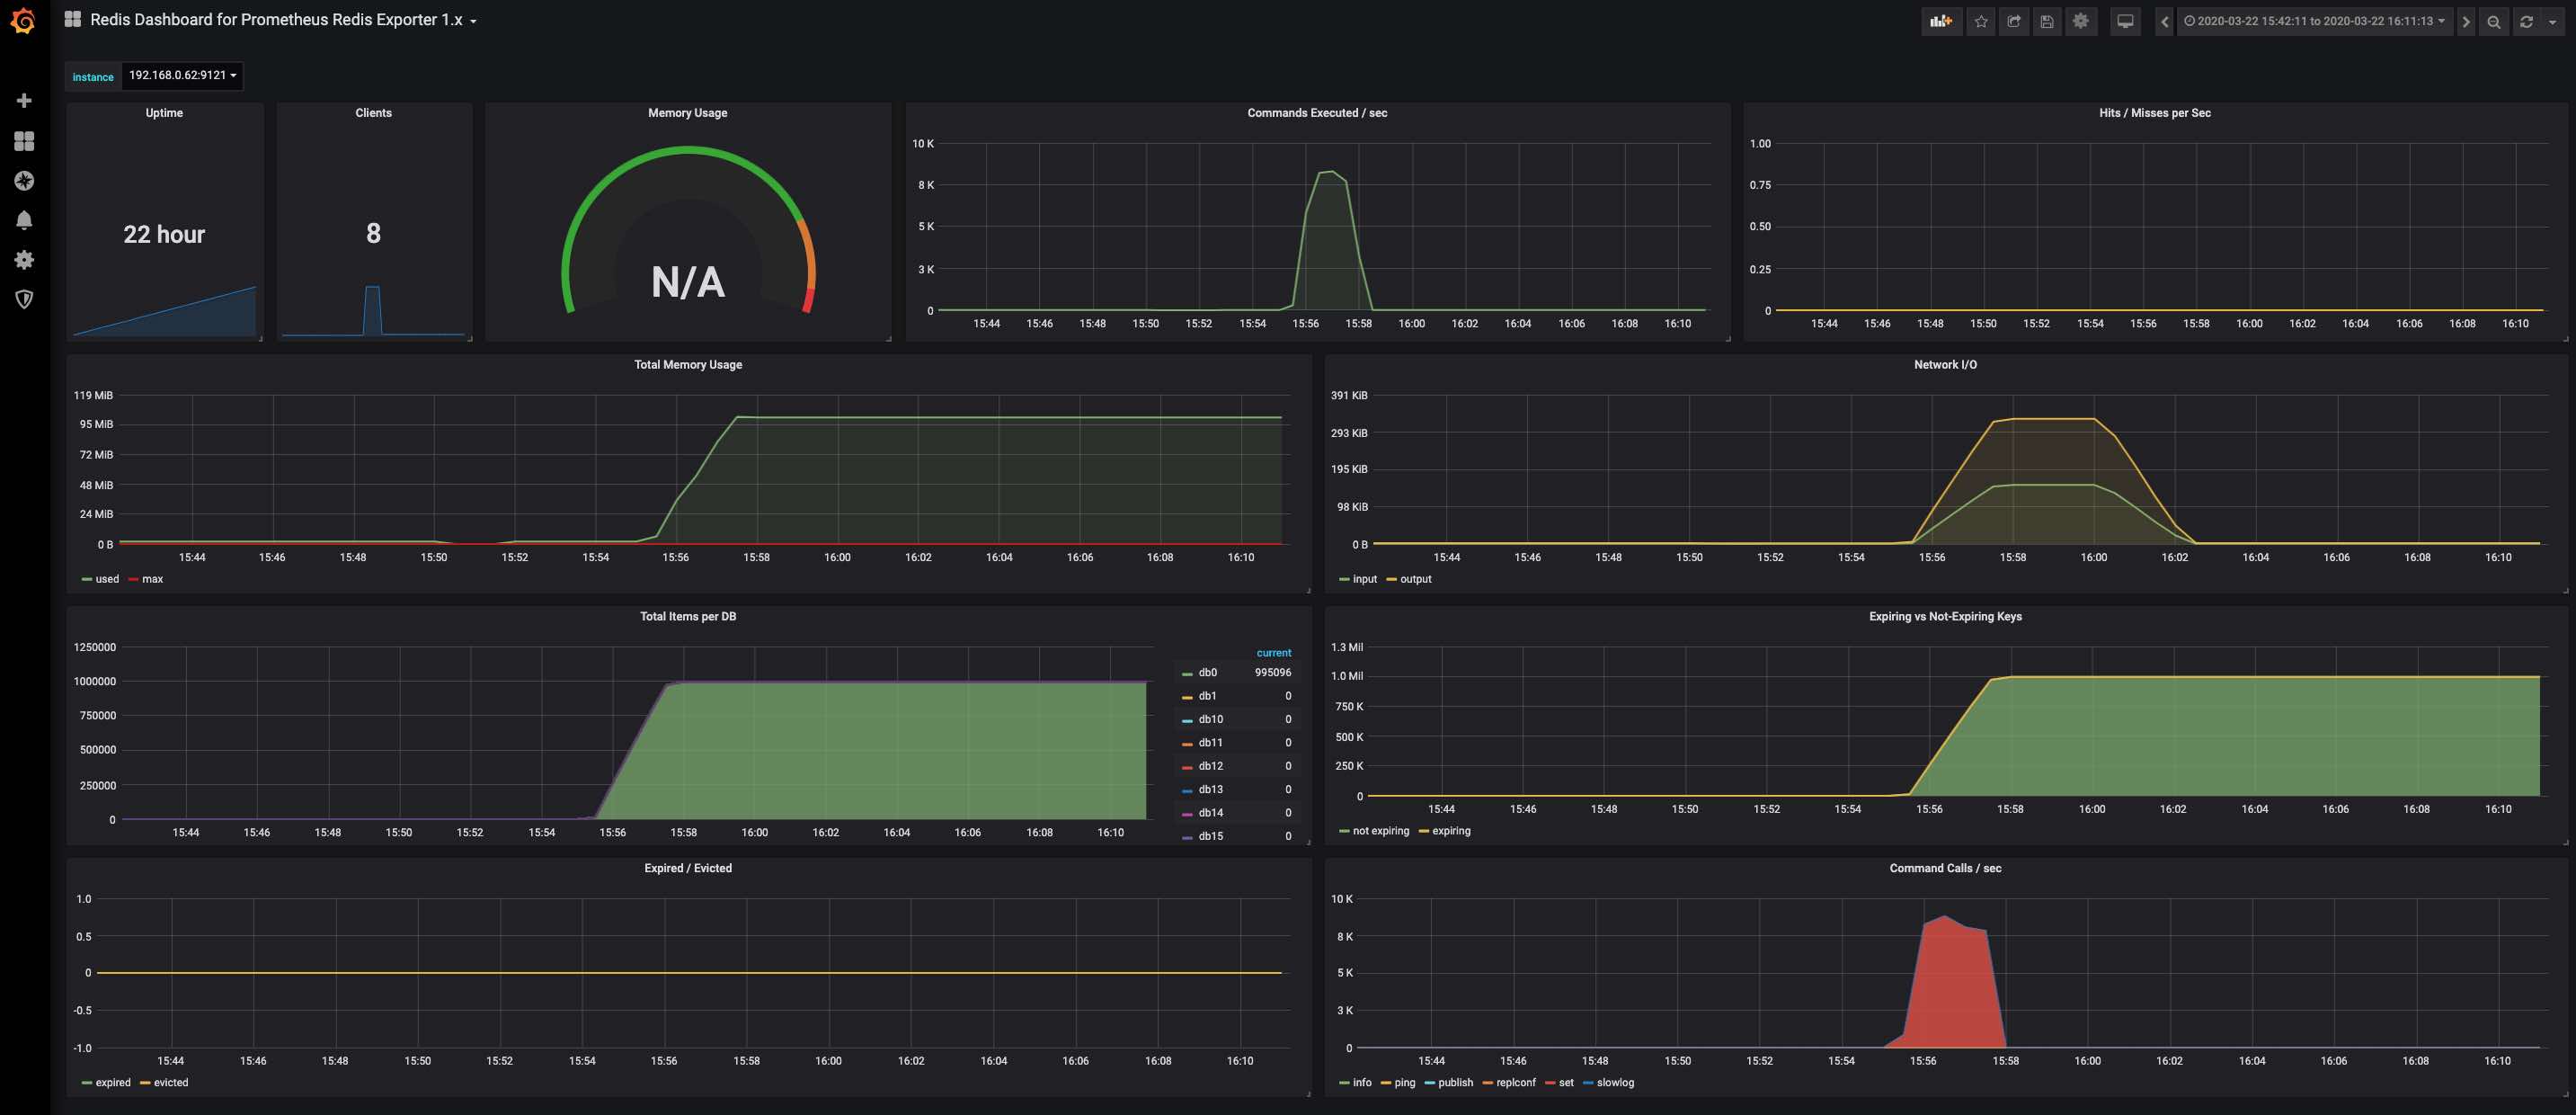
8006.28 requests per secondResults of the metric collection visualised while running benchmarking test to input 1 million keys.
Conclusion
Redis is the most popular in memory database. Its mature, maintained and the sentinel daemon provides reliable resilience to the service.
Slave replication allows balancing reads from masters as well as hot standbys in the event of master failure.
This post demostrates the key features of a redis and sentinel setup in N+1 configuration. N being 2 as we need 2 sentinels for quorum in the event of master failure.
There are many ways to get metrics for redis, prometheus solution is upto date and paired with grafana provides excellent dashboards that can be customised.
Refereneces
https://redis.io/commands/config-get